
🎖️ Welcome to LWRR , You can try to search for information of interest here

🎉 Serve the future intelligent design breeding
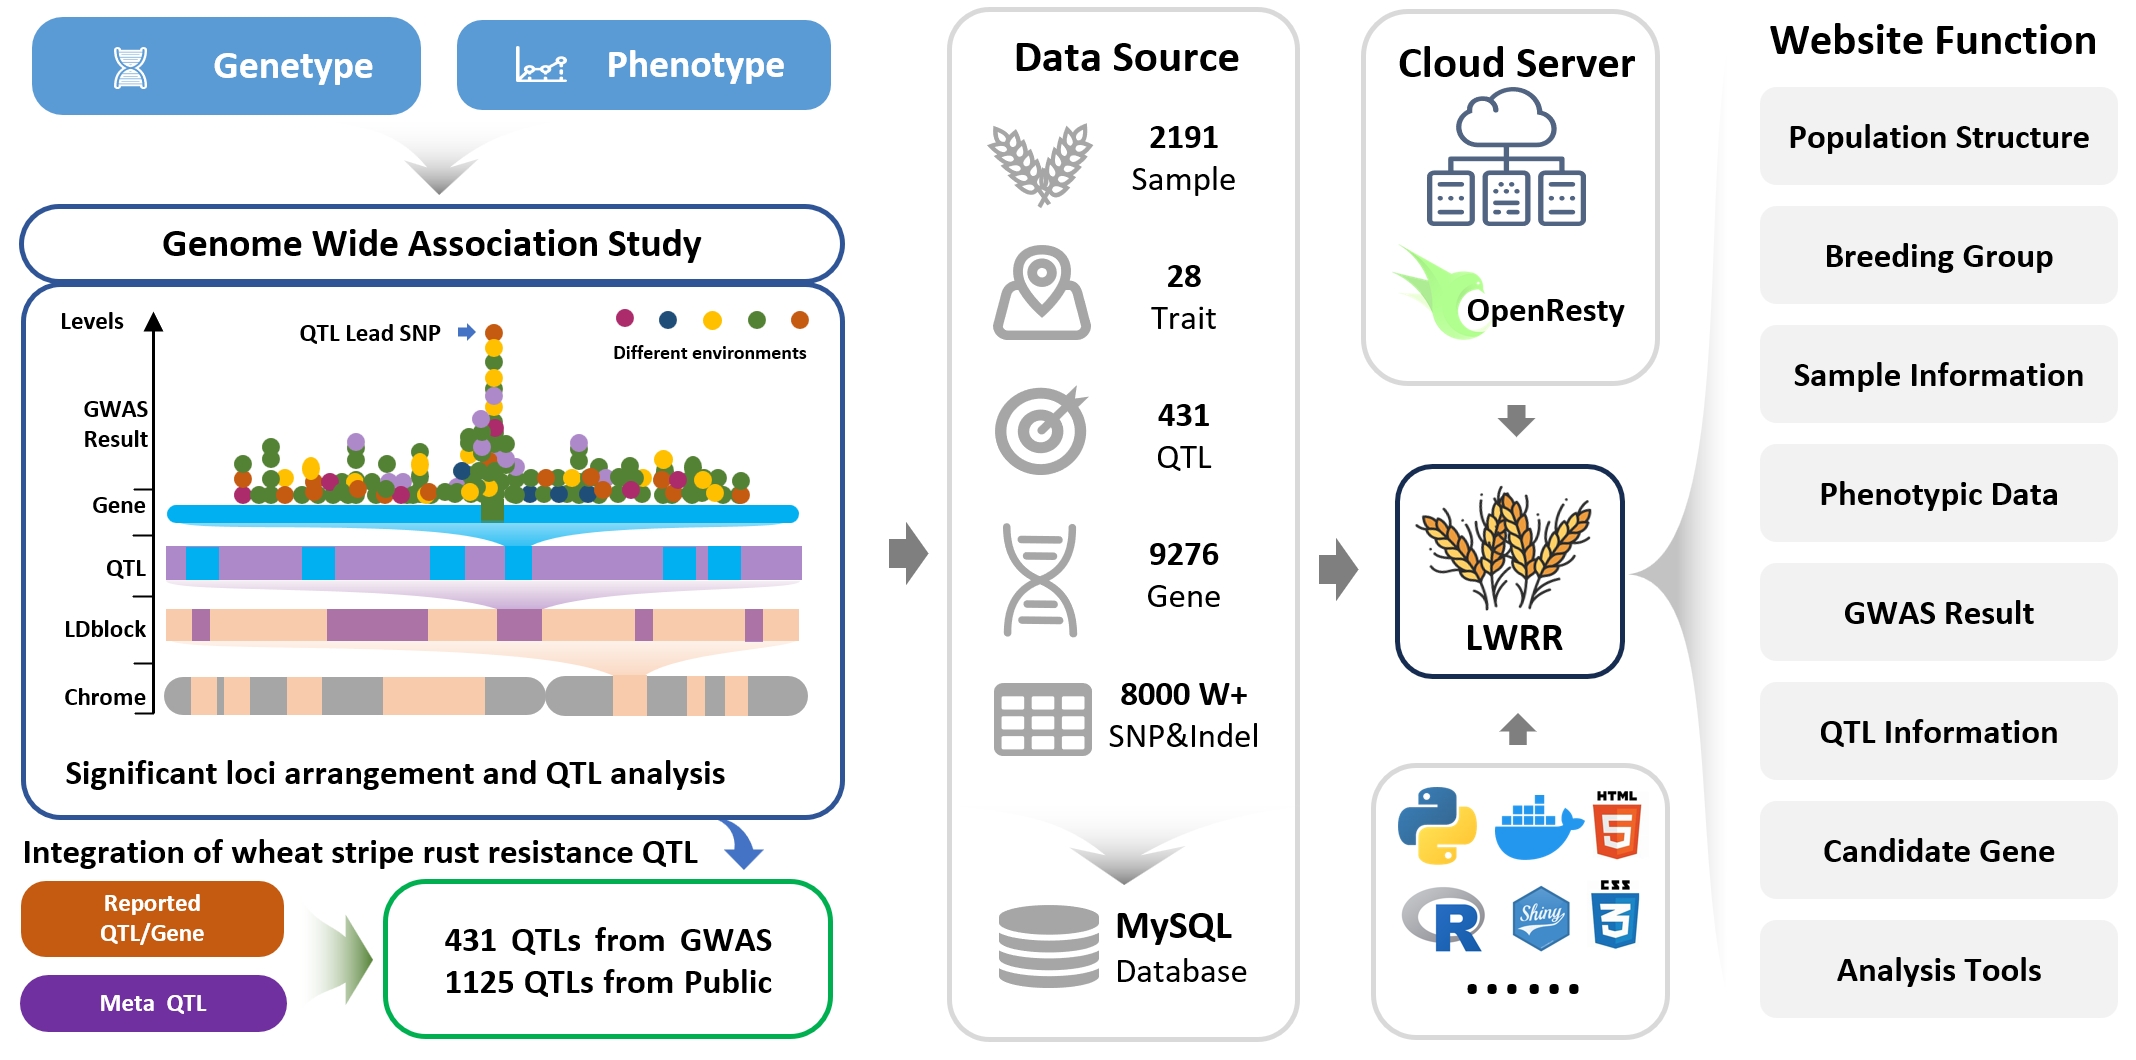
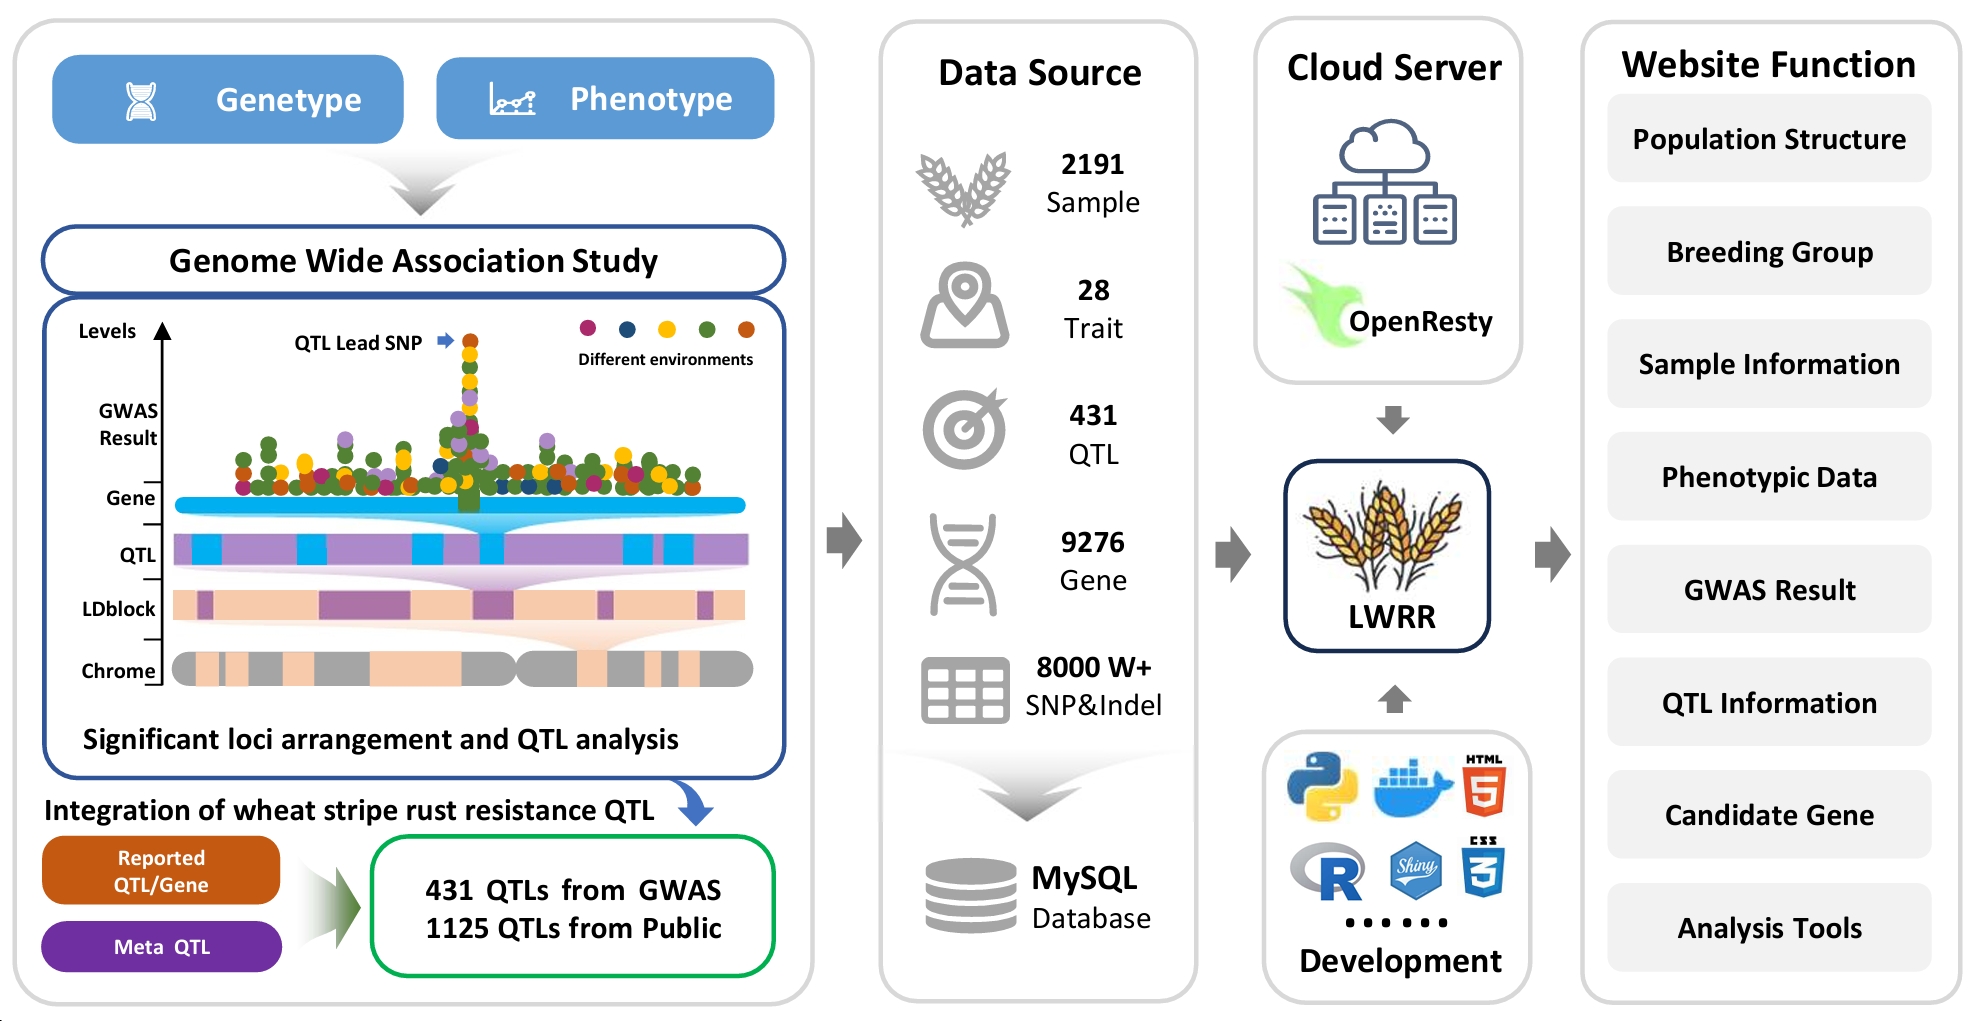
LWRR (https://wheat.dftianyi.com) is a comprehensive web-based platform integrating extensive phenotypic and genotypic data from 2,191 wheat accessions, aiming to facilitate the application by breeders during variety cultivation. LWRR features seven integrated modules covering population structure analysis, trait exploration, GWAS results visualization, QTL information, and candidate gene analysis. Additionally, it offers cloud-based analytical tools allowing users to analyze their own data securely. The development of LWRR represents a significant step forward in bridging the gap between genetic discovery and practical breeding applications.
If you have used data from this website, please refer to the following:
-
Jianhui Wu, Shengwei Ma, Jianqing Niu, Weihang Sun, Haitao Dong, Shusong Zheng, Jiwen Zhao, Shengjie Liu, Rui Yu, Ying Li, Jinyu Han, Yimin Wang, Tiantian Chen,Chuanliang Zhang, Wenjing Zhang, Bingyou Ding, Lu Chang, Wenbo Xue, Weijun Zheng,Chunlian Li, Dejun Han*, Zhensheng Kang*, Qingdong Zeng* and Hong-Qing Ling* . 2025 . Genomics-guided landscape unlocks superior alleles and genes for yellow rust resistance in wheat
-
Jiwen Zhao; Haitao Dong; Jinyu Han; Jingrui Ou; Tiantian Chen; Yuze Wang; Shengjie Liu; Rui Yu; Weijun Zheng; Chunlian Li; Zhensheng Kang; Dejun Han; Qingdong Zeng*; Xiaojie Wang*; Shengwei Ma*; Jianhui Wu*. 2025.LWRR: Landscape of Wheat Rust Resistance towards practical breeding design
Population source world map
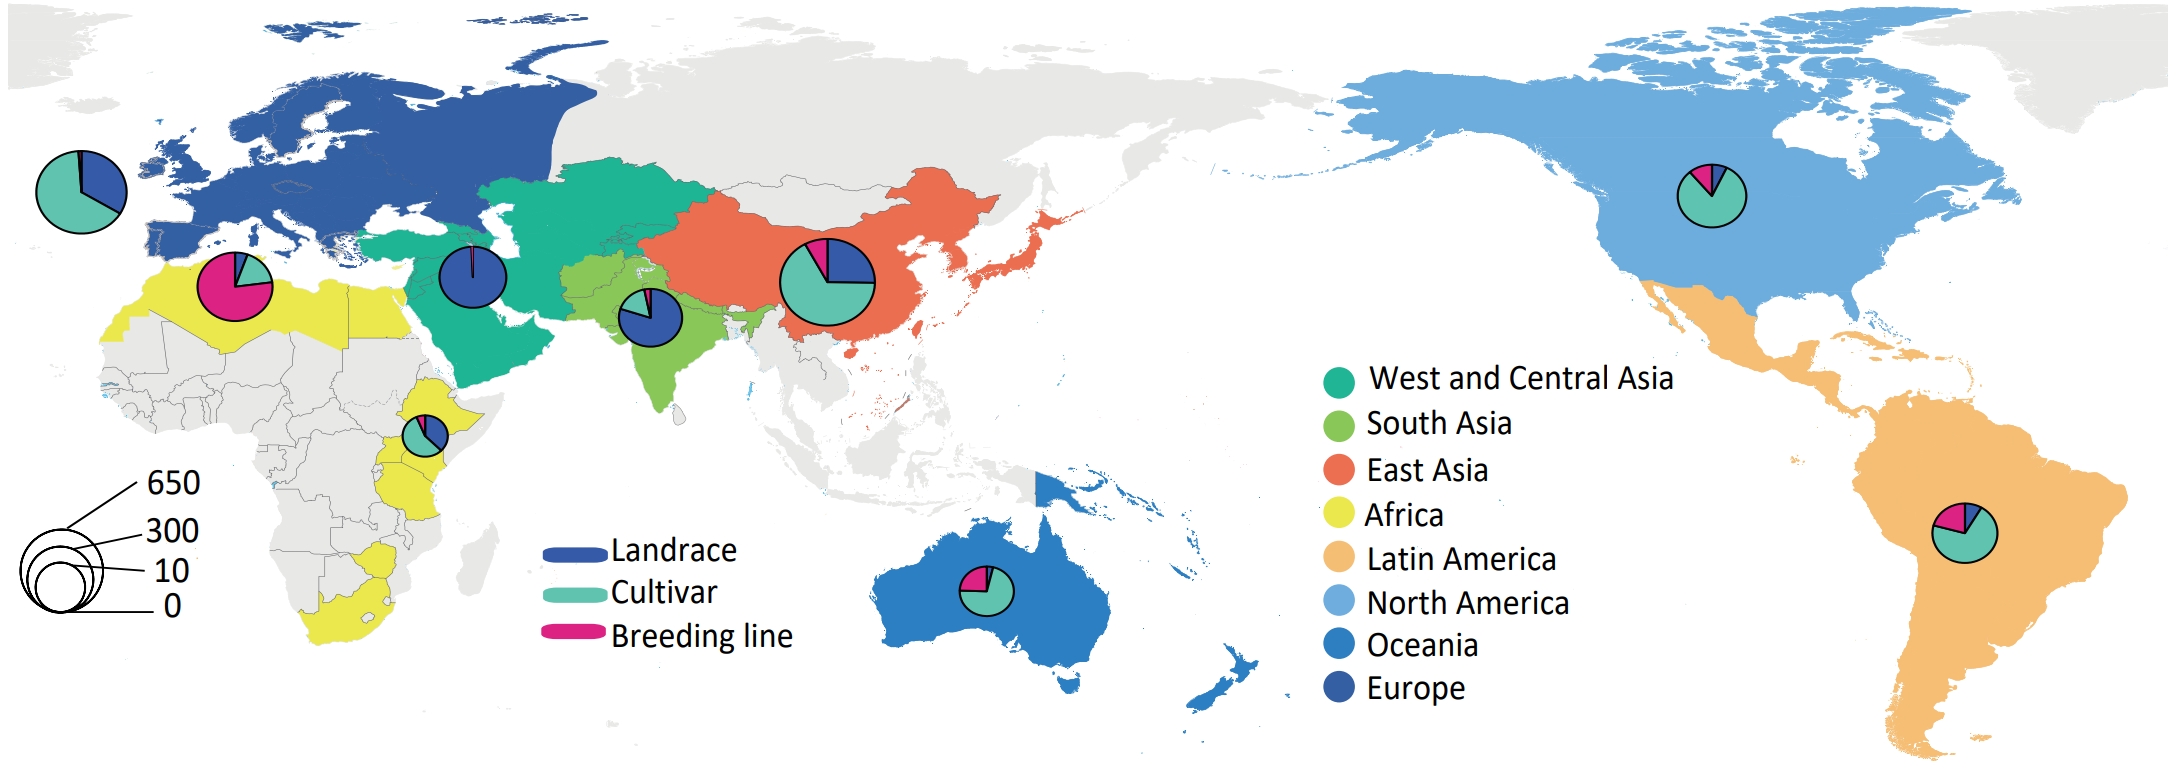
✨ Annotation: The samples come from all over the world and have a wide range of regional and genetic diversity. 272 from Africa, 929 from Asia, 640 from Europe, 298 from Americas, 52 from Oceania. This panel consisted of 684 landraces and 1,507 cultivars.
Structure of Population
The above results are based on the Admixture(https://dalexander.github.io/admixture) software for population structure analysis of genotypes of 2191 materials, and presented the data of 2191 materials in each component uniformly. You can click on any material to obtain the corresponding calculation result, and the local selection function is provided below the X-axis, making it convenient for you to view a specific location.
Principal Component Analysis of Population
Query the information and characteristics of wheat breeding group (BG)
Diversity and selection of different breeding groups (Pi & FST)
Tips:
1. Pi was calculated using samples from BG1-BG4, landrace(LC), and non-landrace(NLC)
2. FST was calculated using the resistant samples in each breeding group compared with the landrace
3. The sliding window step was 0.1Mb and the window size was 100kb ( vcftools , https://vcftools.github.io/)
Nucleotide diversity (π) of each breeding group can reflect the polymorphism of variation sites in different physical regions. This allows researchers to quantify the genetic diversity within a population, which reflects the average percentage of base differences between individual DNA sequences within the population
FST is a measure of population differentiation and genetic distance. The greater the differentiation index, the greater the difference between subpopulations. It can be used to compare the diversity of subgroups and measure the degree of population differentiation.
The phenotype of wheat yellow rust during the seedling stage.
Please select a Pst race to view the phenotype :
Adult-Plant Resistance of wheat yellow rust phenotypes
Phenotypic identification methods and standards for wheat yellow rust
Query the phenotype and basic information of sample
What QTLs are present in this sample
Map of whole chromosome disease resistance sites
Query the results of GWAS by different phenotypes
View the result information for a specific interval
✨ Please select a region to view detail, the page will show the corresponding region of significant variation sites, and provide a table of results.
Note: Please do not enter a large range of interval, ensure that the distance from Start to End is less than 20MB
⚠️ The content of the following page is empty by default, please modify the parameters according to the need to click on the green button to get the results of the information.
The variation information corresponding to the significant peak :
Overall Quick View (Explore QTL information of wheat rust resistance)
Search QTL information online
The genotype frequency variation of this QTL
Samples containing Resistance alleles in this QTL
Phenotypic box-and-line plot showing different genotypes
Search Gene (Chinese Spring 2.1)
Gene Infomation
Selective domestication analysis of 10MB around the gene region
The above shows the Pi and Fst of the gene you submitted your query within the surrounding 10Mb region
The variation sites of the gene region and LDblock plot
Variation sites plot
Analysis of wheat resistance candidate genes
Sample names and phenotype names must not contain special characters, use letters as the first character, and use NA to fill in missing values.
You need to upload the file in standard format (please download to see example data) first and then analyze it.
Output Result : (Please upload data for analysis first)
Note :After each parameter change, please click the button to analyze it.(Association analysis was performed based on candidate genes)
📢 Select a phenotype to determine the difference between haplotypes. The HAP Number parameter specifies the expected number of haplotypes. The results are divided into different haplotypes according to the clustering algorithm
References
- Agenbag GM, Pretorius ZA, Boyd LA, Bender CM, MacCormack R, Prins R (2014) High-resolution mapping and new marker development for adult plant stripe rust resistance QTL in the wheat cultivar Kariega. Mol Breeding 34:2005–2020. https://doi.org/10.1007/s11032-014-0158-4
- Agenbag GM, Pretorius ZA, Boyd LA, Bender CM, Prins R (2012) Identification of adult plant resistance to stripe rust in the wheat cultivar Cappelle-Desprez. Theor Appl Genet 125:109–120. https://doi.org/10.1007/s00122-012-1819-5
- Bai B, Li Z, Wang H, Du X, Wu L, Du J, Lan C (2022) Genetic analysis of adult plant resistance to stripe rust in common wheat cultivar “Pascal.” Front Plant Sci 13:918437. https://doi.org/10.3389/fpls.2022.918437
- Bansal M, Kaur S, Dhaliwal HS, Bains NS, Bariana HS, Chhuneja P, Bansal UK (2017) Mapping of Aegilops umbellulata -derived leaf rust and stripe rust resistance loci in wheat. Plant Pathol 66:38–44. https://doi.org/10.1111/ppa.12549
- Bansal UK, Forrest KL, Hayden MJ, Miah H, Singh D, Bariana HS (2011) Characterisation of a new stripe rust resistance gene Yr47 and its genetic association with the leaf rust resistance gene Lr52. Theor Appl Genet 122:1461–1466. https://doi.org/10.1007/s00122-011-1545-4
- Bansal UK, Kazi AG, Singh B, Hare RA, Bariana HS (2014) Mapping of durable stripe rust resistance in a durum wheat cultivar Wollaroi. Mol Breeding 33:51–59. https://doi.org/10.1007/s11032-013-9933-x
- Baranwal D, Cu S, Stangoulis J, Trethowan R, Bariana H, Bansal U (2022) Identification of genomic regions conferring rust resistance and enhanced mineral accumulation in a HarvestPlus Association Mapping Panel of wheat. Theor Appl Genet 135:865–882. https://doi.org/10.1007/s00122-021-04003-w
- Bariana H S, Parry N, Barclay I R, Loughman R, Mclean R J, Shankar M, Wilson R E, Willey N J, Francki M. Identification and characterization of stripe rust resistance gene Yr34 in common wheat. Theor Appl Genet, 2006, 112(6): 1143-1148.
- Bariana H, Forrest K, Qureshi N, Miah H, Hayden M, Bansal U (2016) Adult plant stripe rust resistance gene Yr71 maps close to Lr24 in chromosome 3D of common wheat. Mol Breeding 36:98. https://doi.org/10.1007/s11032-016-0528-1
- Bariana HS, Bansal UK, Schmidt A, Lehmensiek A, Kaur J, Miah H, Howes N, McIntyre CL (2010) Molecular mapping of adult plant stripe rust resistance in wheat and identification of pyramided QTL genotypes. Euphytica 176:251–260. https://doi.org/10.1007/s10681-010-0240-x
- Basnet B R, Singh R P, Ibrahim A M H, Herrera-Foessel S A, Huerta-Espino J, Lan C, Rudd J C. Characterization of Yr54 and other genes associated with adult plant resistance to yellow rust and leaf rust in common wheat Quaiu 3. Mol Breed, 2014, 33(2): 385-399.
- Bokore FE, Cuthbert RD, Knox RE, Randhawa HS, Hiebert CW, DePauw RM, Singh AK, Singh A, Sharpe AG, N’Diaye A, Pozniak CJ, McCartney C, Ruan Y, Berraies S, Meyer B, Munro C, Hay A, Ammar K, Huerta-Espino J, et al (2017) Quantitative trait loci for resistance to stripe rust of wheat revealed using global field nurseries and opportunities for stacking resistance genes. Theor Appl Genet 130:2617–2635. https://doi.org/10.1007/s00122-017-2980-7
- Buerstmayr M, Matiasch L, Mascher F, Vida G, Ittu M, Robert O, Holdgate S, Flath K, Neumayer A, Buerstmayr H (2014) Mapping of quantitative adult plant field resistance to leaf rust and stripe rust in two European winter wheat populations reveals co-location of three QTL conferring resistance to both rust pathogens. Theor Appl Genet 127:2011–2028. https://doi.org/10.1007/s00122-014-2357-0
- Calvo-Salazar V, Singh RP, Huerta-Espino J, Cruz-Izquierdo S, Lobato-Ortiz R, Sandoval-Islas S, Vargas-Hernández M, German S, Silva P, Basnet BR, Lan CX, Herrera-Foessel SA (2015) Genetic analysis of resistance to leaf rust and yellow rust in spring wheat cultivar Kenya Kongoni. Plant Dis 99:1153–1160. https://doi.org/10.1094/PDIS-07-14-0718-RE
- Cao X, Zhou J, Gong X, Zhao G, Jia J, Qi X (2012) Identification and validation of a major quantitative trait locus for slow-rusting resistance to stripe rust in Wheat. J Integr Plant Biol 54:330–344. https://doi.org/10.1111/j.1744-7909.2012.01111.x
- Carter AH, Chen XM, Garland-Campbell K, Kidwell KK (2009) Identifying QTL for high-temperature adult-plant resistance to stripe rust (Puccinia striiformis f. sp. tritici) in the spring wheat (Triticum aestivum L.) cultivar ‘Louise.’ Theor Appl Genet 119:1119–1128. https://doi.org/10.1007/s00122-009-1114-2
- Case AJ, Naruoka Y, Chen X, Garland-Campbell KA, Zemetra RS, Carter AH (2014) Mapping stripe rust resistance in a Brundage X Coda winter wheat recombinant inbred line population. PLoS One 9:e91758. https://doi.org/10.1371/journal.pone.0091758
- Chen J, Chu C, Souza EJ, Guttieri MJ, Chen X, Xu S, Hole D, Zemetra R (2012) Genome-wide identification of QTL conferring high-temperature adult-plant (HTAP) resistance to stripe rust (Puccinia striiformis f. sp. tritici) in wheat. Mol Breeding 29:791–800. https://doi.org/10.1007/s11032-011-9590-x
- Cheng B, Gao X, Cao N, Ding Y, Chen T, Zhou Q, Gao Y, Xin Z, Zhang L (2022) QTL mapping for adult plant resistance to wheat stripe rust in M96-5 × Guixie 3 wheat population. J Appl Genet 63:265–279. https://doi.org/10.1007/s13353-022-00686-z
- Cheng P, Xu LS, Wang MN, See DR, Chen XM (2014) Molecular mapping of genes Yr64 and Yr65 for stripe rust resistance in hexaploid derivatives of durum wheat accessions PI 331260 and PI 480016. Theor Appl Genet 127:2267–2277. https://doi.org/10.1007/s00122-014-2378-8
- Cheng, S., Feng, C., Wingen, L.U. et al. Harnessing landrace diversity empowers wheat breeding. Nature 632, 823–831 (2024). https://doi.org/10.1038/s41586-024-07682-9
- Chhuneja P, Kaur S, Goel RK, Dhaliwal HS (2006) Mapping of leaf rust and stripe rust resistance QTLs in bread wheat x synthetic RIL population under Indian field conditions. Indian J Crop Sci 1:49-54.
- Christiansen MJ, Feenstra B, Skovgaard IM, Andersen SB (2006) Genetic analysis of resistance to yellow rust in hexaploid wheat using a mixture model for multiple crosses. Theor Appl Genet 112:581–591. https://doi.org/10.1007/s00122-005-0128-7
- Christopher MD, Liu S, Hall MD, Marshall DS, Fountain MO, Johnson JW, Milus EA, Garland‐Campbell KA, Chen X, Griffey CA (2013b) Identification and mapping of adult plant stripe rust resistance in soft red winter wheat VA00W‐38. Crop Sci 53:871–879. https://doi.org/10.2135/cropsci2012.02.0086
- Cobo N, Pflüger L, Chen X, Dubcovsky J (2018) Mapping QTL for resistance to new virulent races of wheat stripe rust from two Argentinean wheat cultivars. Crop Sci 58:2470–2483. https://doi.org/10.2135/cropsci2018.04.0286
- Dedryver F, Paillard S, Mallard S, Robert O, Trottet M, Nègre S, Verplancke G, Jahier J (2009) Characterization of genetic components involved in durable resistance to stripe rust in the bread wheat ‘Renan.’ Phytopathology® 99:968–973. https://doi.org/10.1094/PHYTO-99-8-0968
- Deng M, Long L, Cheng Y, Yao F, Guan F, Wang Y, Li H, Pu Z, Li W, Jiang Q, Wei Y, Ma J, Kang H, Qi P, Wang J, Zheng Y, Jiang Y, Chen G (2022) Mapping a stable adult-plant stripe rust resistance QTL on chromosome 6AL in Chinese wheat landrace Yibinzhuermai. Crop J 10:1111–1119. https://doi.org/10.1016/j.cj.2021.10.011
- Deng Y, Zhai K, Xie Z, Yang D, Zhu X, Liu J, Wang X, Qin P, Yang Y, Zhang G, Li Q, Zhang J, Wu S, Milazzo J, Mao B, Wang E, Xie H, Tharreau D, He Z. Epigenetic regulation of antagonistic receptors confers rice blast resistance with yield balance. Science, 2017, 355(6328): 962-965.
- Dong Z, Hegarty J M, Zhang J, Zhang W, Chao S, Chen X, Zhou Y, Dubcovsky J. Validation and characterization of a QTL for adult plant resistance to stripe rust on wheat chromosome arm 6BS (Yr78). Theor Appl Genet, 2017, 130(10): 2127-2137.
- Eriksen L, Afshari F, Christiansen MJ, McIntosh RA, Jahoor A, Wellings CR (2004) Yr32 for resistance to stripe (yellow) rust present in the wheat cultivar Carstens V. Theor Appl Genet 108:576–576. https://doi.org/10.1007/s00122-003-1573-9
- Farzand M, Dhariwal R, Hiebert CW, Spaner D, Randhawa HS (2022) QTL mapping for adult plant field resistance to stripe rust in the AAC Cameron/P2711 spring wheat population. Crop Sci 62:1088–1106. https://doi.org/10.1002/csc2.20741
- Feng J, Wang M, See D R, Chao S, Zheng Y, Chen X. Characterization of Novel Gene Yr79 and Four Additional Quantitative Trait Loci for All-Stage and High-Temperature Adult-Plant Resistance to Stripe Rust in Spring Wheat PI 182103. Phytopathology, 2018, 108(6): 737-747.
- Feng J, Yao F, Wang M, See DR, Chen X (2023) Molecular mapping of Yr85 and comparison with other genes for resistance to stripe rust on wheat chromosome 1B. Plant Dis. https://doi.org/10.1094/PDIS-11-22-2600-RE
- Feng J, Zuo LL, Zhang ZY, Lin RM, Cao YY, Xu SC (2011) Quantitative trait loci for temperature-sensitive resistance to Puccinia striiformis f. sp. tritici in wheat cultivar Flinor. Euphytica 178:321–329. https://doi.org/10.1007/s10681-010-0291-z
- Gebrewahid TW, Zhang P, Zhou Y, Yan X, Xia X, He Z, Liu D, Li Z (2020a) QTL mapping of adult plant resistance to stripe rust and leaf rust in a Fuyu 3/Zhengzhou 5389 wheat population. Crop J 8:655–665. https://doi.org/10.1016/j.cj.2019.09.013
- Gebrewahid TW, Zhou Y, Zhang P, Ren Y, Gao P, Xia X, He Z, Li Z, Liu D (2020b) Mapping of stripe rust and leaf rust resistance quantitative trait loci in the Chinese spring wheat line Mianyang351-15. Phytopathology® 110:1074–1081. https://doi.org/10.1094/PHYTO-08-19-0316-R
- Gessese M, Bariana H, Wong D, Hayden M, Bansal U (2019) Molecular mapping of stripe rust resistance gene Yr81 in a common wheat landrace Aus27430. Plant Dis 103:1166–1171. https://doi.org/10.1094/PDIS-06-18-1055-RE
- Guo Q, Zhang ZJ, Xu YB, Li GH, Feng J, Zhou Y (2008) Quantitative trait loci for high-temperature adult-plant and slow-rusting resistance to Puccinia striiformis f. sp. tritici in wheat cultivars. Phytopathology® 98:803–809. https://doi.org/10.1094/PHYTO-98-7-0803
- Hao Y, Chen Z, Wang Y, Bland D, Buck J, Brown-Guedira G, Johnson J (2011) Characterization of a major QTL for adult plant resistance to stripe rust in US soft red winter wheat. Theor Appl Genet 123:1401–1411. https://doi.org/10.1007/s00122-011-1675-8
- Herrera-Foessel SA, Lagudah ES, Huerta-Espino J, Hayden MJ, Bariana HS, Singh D, Singh RP (2011) New slow-rusting leaf rust and stripe rust resistance genes Lr67 and Yr46 in wheat are pleiotropic or closely linked. Theor Appl Genet 122:239–249. https://doi.org/10.1007/s00122-010-1439-x
- Herrera-Foessel SA, Singh RP, Lan CX, Huerta-Espino J, Calvo-Salazar V, Bansal UK, Bariana HS, Lagudah ES (2015) Yr60, a gene conferring moderate resistance to stripe rust in wheat. Plant Dis 99:508–511. https://doi.org/10.1094/PDIS-08-14-0796-RE
- Hou L, Chen X, Wang M, See DR, Chao S, Bulli P, Jing J (2015) Mapping a large number of QTL for durable resistance to stripe rust in winter wheat Druchamp using SSR and SNP markers. PLoS One 10:e0126794. https://doi.org/10.1371/journal.pone.0126794
- Hou S, Wu F, Wang Z, Yan N, Chen H, Li H, Yang P, Zhang Y, Li C, Lin Y, Ma J, Huang L, Liu Y (2023) Mapping stripe rust resistance QTL in ‘N2496’, a synthetic hexaploid wheat derivative. Plant Dis 107:443–449. https://doi.org/10.1094/PDIS-07-22-1518-RE
- Huang S, Liu S, Zhang Y, Xie Y, Wang X, Jiao H, Wu S, Zeng Q, Wang Q, Singh R P, Bhavani S, Kang Z, Wang C, Han D, Wu J. Genome-Wide Wheat 55K SNP-Based Mapping of Stripe Rust Resistance Loci in Wheat Cultivar Shaannong 33 and Their Alleles Frequencies in Current Chinese Wheat Cultivars and Breeding Lines. Plant Dis, 2021, 105(4): 1048-156
- Huang S, Wu J, Wang X, Mu J, Xu Z, Zeng Q, Liu S, Wang Q, Kang Z, Han D (2019) Utilization of the genomewide wheat 55K SNP array for genetic analysis of stripe rust resistance in common wheat line P9936. Phytopathology® 109:819–827. https://doi.org/10.1094/PHYTO-10-18-0388-R
- Huang S, Zhang Y, Ren H, Zhang X, Yu R, Liu S, Zeng Q, Wang Q, Yuan F, Singh R P, Bhavani S, Wu J, Han D, Kang Z. High density mapping of wheat stripe rust resistance gene QYrXN3517-1BL using QTL mapping, BSE-Seq and candidate gene analysis. Theor Appl Genet, 2023, 136(3): 39.
- Jambuthenne DT, Riaz A, Athiyannan N, Alahmad S, Ng WL, Ziems L, Afanasenko O, Periyannan SK, Aitken E, Platz G, Godwin I, Voss-Fels KP, Dinglasan E, Hickey LT (2022) Mining the Vavilov wheat diversity panel for new sources of adult plant resistance to stripe rust. Theor Appl Genet 135:1355–1373. https://doi.org/10.1007/s00122-022-04037-8
- Jia M, Yang L, Zhang W, Rosewarne G, Li J, Yang E, Chen L, Wang W, Liu Y, Tong H, He W, Zhang Y, Zhu Z, Gao C (2020) Genome-wide association analysis of stripe rust resistance in modern Chinese wheat. BMC Plant Biol 20:491. https://doi.org/10.1186/s12870-020-02693-w
- Joukhadar R, Hollaway G, Shi F, Kant S, Forrest K, Wong D, Petkowski J, Pasam R, Tibbits J, Bariana H, Bansal U, Spangenberg G, Daetwyler H, Gendall T, Hayden M (2020) Genome-wide association reveals a complex architecture for rust resistance in 2300 worldwide bread wheat accessions screened under various Australian conditions. Theor Appl Genet 133:2695–2712. https://doi.org/10.1007/s00122-020-03626-9
- Kaur J, Bansal UK, Khanna R, Saini RG, Bariana HS (2009) Molecular mapping of stem rust resistance in HD2009/WL711 recombinant inbred line population. Int J Plant Breed 3:28–33.
- Klymiuk V, Chawla HS, Wiebe K, Ens J, Fatiukha A, Govta L, Fahima T, Pozniak CJ (2022) Discovery of stripe rust resistance with incomplete dominance in wild emmer wheat using bulked segregant analysis sequencing. Commun Biol 5:826. https://doi.org/10.1038/s42003-022-03773-3
- Klymiuk V, Yaniv E, Huang L, Raats D, Fatiukha A, Chen S, Feng L, Frenkel Z, Krugman T, Lidzbarsky G, Chang W, Jääskeläinen MJ, Schudoma C, Paulin L, Laine P, Bariana H, Sela H, Saleem K, Sørensen CK, et al (2018) Cloning of the wheat Yr15 resistance gene sheds light on the plant tandem kinase-pseudokinase family. Nat Commun 9:3735. https://doi.org/10.1038/s41467-018-06138-9
- Krattinger SG, Lagudah ES, Spielmeyer W, Singh RP, Huerta-Espino J, McFadden H, Bossolini E, Selter LL, Keller B (2009) A putative ABC transporter confers durable resistance to multiple fungal pathogens in wheat. Science 323:1360–1363. https://doi.org/10.1126/science.1166453
- Lan C, Hale IL, Herrera-Foessel SA, Basnet BR, Randhawa MS, Huerta-Espino J, Dubcovsky J, Singh RP (2017) Characterization and mapping of leaf rust and stripe rust resistance loci in hexaploid wheat lines UC1110 and PI610750 under Mexican environments. Front Plant Sci 8: 1450. https://doi.org/10.3389/fpls.2017.01450
- Li C, Wang Z, Li C, Bowden R, Bai G, Li C, Li C, Su Z, Carver BF (2017a) Mapping of quantitative trait loci for leaf rust resistance in the wheat population Ning7840 × Clark. Plant Dis 101:1974–1979. https://doi.org/10.1094/PDIS-12-16-1743-RE
- Li J, Dundas I, Dong C, Li G, Trethowan R, Yang Z, Hoxha S, Zhang P. Identification and characterization of a new stripe rust resistance gene Yr83 on rye chromosome 6R in wheat. Theor Appl Genet, 2020, 133(4): 1095-1107.
- Lin F, Chen XM (2009) Quantitative trait loci for non-race-specific, high-temperature adult-plant resistance to stripe rust in wheat cultivar Express. Theor Appl Genet 118:631–642. https://doi.org/10.1007/s00122-008-0894-0
- Liu D, Yuan C, Singh RP, Randhawa MS, Bhavani S, Kumar U, Huerta-Espino J, Lagudah E, Lan C (2022) Stripe rust and leaf rust resistance in CIMMYT wheat line “Mucuy” is conferred by combinations of race-specific and adult-plant resistance loci. Front Plant Sci 13: 880138. https://doi.org/10.3389/fpls.2022.880138
- Liu J, Chang Z, Zhang X, Yang Z, Li X, Jia J, Zhan H, Guo H, Wang J. Putative Thinopyrum intermedium-derived stripe rust resistance gene Yr50 maps on wheat chromosome arm 4BL. Theor Appl Genet, 2013, 126(1): 265-274.
- Liu L, Wang M, Feng J, See DR, Chen X (2019a) Whole-genome mapping of stripe rust resistance quantitative trait loci and race specificity related to resistance reduction in winter wheat cultivar Eltan. Phytopathology® 109:1226–1235. https://doi.org/10.1094/PHYTO-10-18-0385-R
- Liu L, Yuan C, Wang M, See DR, Chen X (2020a) Mapping quantitative trait loci for high-temperature adult-plant resistance to stripe rust in spring wheat PI 197734 using a doubled haploid population and genotyping by multiplexed sequencing. Front Plant Sci 11: 596962. https://doi.org/10.3389/fpls.2020.596962
- Liu L, Yuan CY, Wang MN, See DR, Zemetra RS, Chen XM (2019b) QTL analysis of durable stripe rust resistance in the north American winter wheat cultivar Skiles. Theor Appl Genet 132:1677–1691. https://doi.org/10.1007/s00122-019-03307-2
- Liu P, Shi C, Liu S, Lei J, Lu Q, Hu H, Ren Y, Zhang N, Sun C, Chen L, Jiang Y, Feng L, Zhang T, Zhong K, Liu J, Zhang J, Zhang Z, Sun B, Chen J, Tang Y, Chen F, Yang J. A papain-like cysteine protease-released small signal peptide confers wheat resistance to wheat yellow mosaic virus. Nat Commun, 2023, 14(1).
- Liu Q, Deng S, Liu B, Tao Y, Ai H, Liu J, Zhang Y, Zhao Y, Xu M. A helitron-induced RabGDIα variant causes quantitative recessive resistance to maize rough dwarf disease. Nat Commun, 2020, 11(1): 495.
- Liu S, Huang S, Zeng Q, Wang X, Yu R, Wang Q, Singh RP, Bhavani S, Kang Z, Wu J, Han D (2021) Refined mapping of stripe rust resistance gene YrP10090 within a desirable haplotype for wheat improvement on chromosome 6A. Theor Appl Genet 134:2005–2021. https://doi.org/10.1007/s00122-021-03801-6
- Liu S, Liu D, Zhang C, Zhang W, Wang X, Mi Z, Gao X, Ren Y, Lan C, Liu X, Zhao Z, Liu J, Li H, Yuan F, Su B, Kang Z, Li C, Han D, Wang C, Cao X, Wu J. Slow stripe rusting in Chinese wheat Jimai 44 conferred by Yr29 in combination with a major QTL on chromosome arm 6AL. Theor Appl Genet, 2023, 136(8): 175.
- Liu W., Naruoka, Y., Miller, K., Garland-Campbell, K.A. and Carter, A.H. (2018), Characterizing and Validating Stripe Rust Resistance Loci in US Pacific Northwest Winter Wheat Accessions (Triticum aestivum L.) by Genome-wide Association and Linkage Mapping. The Plant Genome, 11: 170087. https://doi.org/10.3835/plantgenome2017.10.0087
- Liu X, Khajuria C, Li J, Trick H N, Huang L, Gill B S, Reeck G R, Antony G, White F F, Chen M. Wheat Mds-1 encodes a heat-shock protein and governs susceptibility towards the Hessian fly gall midge. Nat Commun, 2013, 4(1): 2070.
- Liu Y, Qie Y, Li X, Wang M, Chen X (2020b) Genome-wide mapping of quantitative trait loci conferring all-stage and high-temperature adult-plant resistance to stripe rust in spring wheat landrace PI 181410. Int J Mol Sci 21:478. https://doi.org/10.3390/ijms21020478
- Long L, Yao F, Guan F, Cheng Y, Duan L, Zhao X, Li H, Pu Z, Li W, Jiang Q, Wei Y, Ma J, Kang H, Dai S, Qi P, Xu Q, Deng M, Zheng Y, Jiang Y, et al (2021) A stable quantitative trait locus on chromosome 5BL combined with Yr18 conferring high-level adult plant resistance to stripe rust in Chinese wheat landrace Anyuehong. Phytopathology® 111:1594–1601. https://doi.org/10.1094/PHYTO-10-20-0465-R
- Lowe I, Jankuloski L, Chao S, Chen X, See D, Dubcovsky J. Mapping and validation of QTL which confer partial resistance to broadly virulent post-2000 North American races of stripe rust in hexaploid wheat. Theor Appl Genet, 2011, 123(1): 143-157.
- Lu Y, Lan C, Liang S, Zhou X, Liu D, Zhou G, Lu Q, Jing J, Wang M, Xia X, He Z (2009) QTL mapping for adult-plant resistance to stripe rust in Italian common wheat cultivars Libellula and Strampelli. Theor Appl Genet 119:1349–1359. https://doi.org/10.1007/s00122-009-1139-6
- Lu Y, Wang M, Chen X, See D, Chao S, Jing J. Mapping of Yr62 and a small-effect QTL for high-temperature adult-plant resistance to stripe rust in spring wheat PI 192252. Theor Appl Genet, 2014, 127(6): 1449-1459.
- Luo P G, Ren Z L, Zhang H Q, Zhang H Y. Identification, Chromosome Location, and Diagnostic Markers for a New Gene (YrCN19) for Resistance to Wheat Stripe Rust. Phytopathology, 2005, 95(11): 1266-1270.
- Ma J, Qin N, Cai B, Chen G, Ding P, Zhang H, Yang C, Huang L, Mu Y, Tang H, Liu Y, Wang J, Qi P, Jiang Q, Zheng Y, Liu C, Lan X, Wei Y (2019) Identification and validation of a novel major QTL for all-stage stripe rust resistance on 1BL in the winter wheat line 20828. Theor Appl Genet 132:1363–1373. https://doi.org/10.1007/s00122-019-03283-7
- Mallard S, Gaudet D, Aldeia A, Abelard C, Besnard AL, Sourdille P, Dedryver F (2005) Genetic analysis of durable resistance to yellow rust in bread wheat. Theor Appl Genet 110:1401–1409. https://doi.org/10.1007/s00122-005-1954-3
- Marais G F, Pretorius Z A, Wellings C R, Mccallum B, Marais A S. Leaf rust and stripe rust resistance genes transferred to common wheat from Triticum dicoccoides. Euphytica, 2005, 143(1-2): 115-123.
- Marchal C, Zhang J, Zhang P, Fenwick P, Steuernagel B, Adamski NM, Boyd L, McIntosh R, Wulff BBH, Berry S, Lagudah E, Uauy C (2018) BED-domain-containing immune receptors confer diverse resistance spectra to yellow rust. Nat Plants 4:662–668. https://doi.org/10.1038/s41477-018-0236-4
- Melichar JPE, Berry S, Newell C, MacCormack R, Boyd LA (2008) QTL identification and microphenotype characterisation of the developmentally regulated yellow rust resistance in the UK wheat cultivar Guardian. Theor Appl Genet 117:391–399. https://doi.org/10.1007/s00122-008-0783-6
- Miedaner, T., Akel, W., Flath, K. et al. Molecular tracking of multiple disease resistance in a winter wheat diversity panel. Theor Appl Genet 133, 419–431 (2020). https://doi.org/10.1007/s00122-019-03472-4
- Moore JW, Herrera-Foessel S, Lan C, Schnippenkoetter W, Ayliffe M, Huerta-Espino J, Lillemo M, Viccars L, Milne R, Periyannan S, Kong X, Spielmeyer W, Talbot M, Bariana H, Patrick JW, Dodds P, Singh R, Lagudah E (2015) A recently evolved hexose transporter variant confers resistance to multiple pathogens in wheat. Nat Genet 47:1494–1498. https://doi.org/10.1038/ng.3439
- Mu J, Dai M, Wang X, Tang X, Huang S, Zeng Q, Wang Q, Liu S, Yu S, Kang Z, Han D. Combining genome-wide linkage mapping with extreme pool genotyping for stripe rust resistance gene identification in bread wheat. Mol Breed, 2019, 39(6).
- Mu J, Huang S, Liu S, Zeng Q, Dai M, Wang Q, Wu J, Yu S, Kang Z, Han D (2019) Genetic architecture of wheat stripe rust resistance revealed by combining QTL mapping using SNP-based genetic maps and bulked segregant analysis. Theor Appl Genet 132:443–455. https://doi.org/10.1007/s00122-018-3231-2
- Paillard S, Trotoux-Verplancke G, Perretant M-R, Mohamadi F, Leconte M, Coëdel S, de Vallavieille-Pope C, Dedryver F (2012) Durable resistance to stripe rust is due to three specific resistance genes in French bread wheat cultivar Apache. Theor Appl Genet 125:955–965. https://doi.org/10.1007/s00122-012-1885-8
- Pakeerathan K, Bariana H, Qureshi N, Wong D, Hayden M, Bansal U. Identification of a new source of stripe rust resistance Yr82 in wheat. Theor Appl Genet, 2019, 132(11): 3169-3176.
- Pang Y, Liu C, Lin M, Ni F, Li W, Cai J, Zhang Z, Zhu H, Liu J, Wu J, Bai G, Liu S (2022) Mapping QTL for adult-plant resistance to stripe rust in a Chinese wheat landrace. Int J Mol Sci 23:9662. https://doi.org/10.3390/ijms23179662
- Powell NM, Lewis CM, Berry ST, MacCormack R, Boyd LA (2013) Stripe rust resistance genes in the UK winter wheat cultivar Claire. Theor Appl Genet 126:1599–1612. https://doi.org/10.1007/s00122-013-2077-x
- Pretorius ZA, Lan CX, Prins R, Knight V, McLaren NW, Singh RP, Bender CM, Kloppers FJ (2017) Application of remote sensing to identify adult plant resistance loci to stripe rust in two bread wheat mapping populations. Precis Agric 18:411–428. https://doi.org/10.1007/s11119-016-9461-x
- Prins R, Pretorius ZA, Bender CM, Lehmensiek A (2011) QTL mapping of stripe, leaf and stem rust resistance genes in a Kariega × Avocet S doubled haploid wheat population. Mol Breeding 27:259–270. https://doi.org/10.1007/s11032-010-9428-y
- Ramburan VP, Pretorius ZA, Louw JH, Boyd LA, Smith PH, Boshoff WHP, Prins R (2004) A genetic analysis of adult plant resistance to stripe rust in the wheat cultivar Kariega. Theor Appl Genet 108:1426–1433. https://doi.org/10.1007/s00122-003-1567-7
- Randhawa M S, Bariana H S, Mago R, Bansal U K. Mapping of a new stripe rust resistance locus Yr57 on chromosome 3BS of wheat. Mol Breed, 2015, 35(2): 1-8.
- Ren R S, Wang M N, Chen X M, Zhang Z J. Characterization and molecular mapping of Yr52 for high-temperature adult-plant resistance to stripe rust in spring wheat germplasm PI 183527. Theor Appl Genet, 2012, 125(5): 847-857.
- Ren Y, He Z, Li J, Lillemo M, Wu L, Bai B, Lu Q, Zhu H, Zhou G, Du J, Lu Q, Xia X (2012b) QTL mapping of adult-plant resistance to stripe rust in a population derived from common wheat cultivars Naxos and Shanghai 3/Catbird. Theor Appl Genet 125:1211–1221. https://doi.org/10.1007/s00122-012-1907-6
- Ren Y, Li Z, He Z, Wu L, Bai B, Lan C, Wang C, Zhou G, Zhu H, Xia X (2012c) QTL mapping of adult-plant resistances to stripe rust and leaf rust in Chinese wheat cultivar Bainong 64. Theor Appl Genet 125:1253–1262. https://doi.org/10.1007/s00122-012-1910-y
- Rosa SB, Zanella CM, Hiebert CW, Brûlé-Babel AL, Randhawa HS, Shorter S, Boyd LA, McCallum BD (2019) Genetic characterization of leaf and stripe rust resistance in the Brazilian wheat cultivar Toropi. Phytopathology® 109:1760–1768. https://doi.org/10.1094/PHYTO-05-19-0159-R
- Rosewarne GM, Singh RP, Huerta-Espino J, Herrera-Foessel SA, Forrest KL, Hayden MJ, Rebetzke GJ (2012) Analysis of leaf and stripe rust severities reveals pathotype changes and multiple minor QTLs associated with resistance in an Avocet × Pastor wheat population. Theor Appl Genet 124:1283–1294. https://doi.org/10.1007/s00122-012-1786-x
- Santra DK, Chen XM, Santra M, Campbell KG, Kidwell KK (2008) Identification and mapping QTL for high-temperature adult-plant resistance to stripe rust in winter wheat (Triticum aestivum L.) cultivar ‘Stephens.’ Theor Appl Genet 117:793–802. https://doi.org/10.1007/s00122-008-0820-5
- Schulthess, A.W., Kale, S.M., Liu, F., Zhao, Y., Philipp, N., Rembe, M., Jiang, Y., Beukert, U., Serfling, A., and Himmelbach, A., et al. (2022). Genomics-informed prebreeding unlocks the diversity in genebanks for wheat improvement. NAT GENET 54, 1544-1552.
- Shahinnia F, Geyer M, Schürmann F, Rudolphi S, Holzapfel J, Kempf H, Stadlmeier M, Löschenberger F, Morales L, Buerstmayr H, Sánchez J, Akdemir D, Mohler V, Lillemo M, Hartl L (2022) Genome-wide association study and genomic prediction of resistance to stripe rust in current Central and Northern European winter wheat germplasm. Theor Appl Genet 135:3583–3595. https://doi.org/10.1007/s00122-022-04202-z
- Singh A, Knox RE, DePauw RM, Singh AK, Cuthbert RD, Campbell HL, Shorter S, Bhavani S (2014) Stripe rust and leaf rust resistance QTL mapping, epistatic interactions, and co-localization with stem rust resistance loci in spring wheat evaluated over three continents. Theor Appl Genet 127:2465–2477. https://doi.org/10.1007/s00122-014-2390-z
- Suenaga K, Singh RP, Huerta-Espino J, William HM (2003) Microsatellite markers for genes Lr34/Yr18 and other quantitative trait loci for leaf rust and stripe rust resistance in bread wheat. Phytopathology® 93:881–890. https://doi.org/10.1094/PHYTO.2003.93.7.881
- Tehseen MM, Tonk FA, Tosun M, Randhawa HS, Kurtulus E, Ozseven I, Akin B, Nur Zulfuagaoglu O, Nazari K (2022) QTL mapping of adult plant resistance to stripe rust in a doubled haploid wheat population. Front Genet 13: 900558. https://doi.org/10.3389/fgene.2022.900558
- Tehseen MM, Tonk FA, Tosun M, et al. Genome-wide association study of resistance to PstS2 and warrior races of Puccinia striiformis f. sp. tritici (stripe rust) in bread wheat landraces. Plant Genome. 2021; 14:e20066. https://doi.org/10.1002/tpg2.20066
- Vazquez MD, Zemetra R, Peterson CJ, Chen XM, Heesacker A, Mundt CC (2015) Multi-location wheat stripe rust QTL analysis: genetic background and epistatic interactions. Theor Appl Genet 128:1307–1318. https://doi.org/10.1007/s00122-015-2507-z
- Wang H, Zou S, Li Y, Lin F, Tang D. An ankyrin-repeat and WRKY-domain-containing immune receptor confers stripe rust resistance in wheat. Nat Commun, 2020, 11(1).
- Wang MY, Xu MR, Wang FT, Shah SJA, Feng J, Lin RM, Xu SC (2021) Characterization and validation of QTLs for adult plant stripe rust resistance in Chinese wheat landrace Dabaimai. Cereal Res Commun 49:91–98. https://doi.org/10.1007/s42976-020-00071-8
- Wang W, Chen L, Fengler K, Bolar J, Llaca V, Wang X, Clark C B, Fleury T J, Myrvold J, Oneal D, van Dyk M M, Hudson A, Munkvold J, Baumgarten A, Thompson J, Cai G, Crasta O, Aggarwal R, Ma J. A giant NLR gene confers broad-spectrum resistance to Phytophthora sojae in soybean. Nat Commun, 2021, 12(1): 6263.
- Wang Y, Hu Y, Gong F, Jin Y, Xia Y, He Y, Jiang Y, Zhou Q, He J, Feng L, Chen G, Zheng Y, Liu D, Huang L, Wu B (2022a) Identification and mapping of QTL for stripe rust resistance in the Chinese wheat cultivar Shumai126. Plant Dis 106:1278–1285. https://doi.org/10.1094/PDIS-09-21-1946-RE
- William HM, Singh RP, Huerta-Espino J, Palacios G, Suenaga K (2006) Characterization of genetic loci conferring adult plant resistance to leaf rust and stripe rust in spring wheat. Genome 49:977–990. https://doi.org/10.1139/g06-052
- Wu J, Huang S, Zeng Q, Liu S, Wang Q, Mu J, Yu S, Han D, Kang Z. Comparative genome-wide mapping versus extreme pool-genotyping and development of diagnostic SNP markers linked to QTL for adult plant resistance to stripe rust in common wheat. Theor Appl Genet, 2018, 131(8): 1777-1792.
- Wu J, Liu S, Wang Q, Zeng Q, Mu J, Huang S, Yu S, Han D, Kang Z. Rapid identification of an adult plant stripe rust resistance gene in hexaploid wheat by high-throughput SNP array genotyping of pooled extremes. Theor Appl Genet, 2018, 131(1): 43-58.
- Wu J, Wang Q, Kang Z, Liu S, Li H, Mu J, Dai M, Han D, Zeng Q, Chen X (2017) Development and validation of KASP-SNP markers for QTL underlying resistance to stripe rust in common wheat cultivar P10057. Plant Dis 101:2079–2087. https://doi.org/10.1094/PDIS-04-17-0468-RE
- Wu J, Wang Q, Liu S, Huang S, Mu J, Zeng Q, Huang L, Han D, Kang Z. Saturation Mapping of a Major Effect QTL for Stripe Rust Resistance on Wheat Chromosome 2B in Cultivar Napo 63 Using SNP Genotyping Arrays. Front Plant Sci, 2017, 8: 653.
- Wu J, Wang X, Chen N, Yu R, Yu S, Wang Q, Huang S, Wang H, Singh R P, Bhavani S, Kang Z, Han D, Zeng Q. Association analysis identifies new loci for resistance to Chinese Yr26-virulent races of the stripe rust pathogen in a diverse panel of wheat germplasm. Plant Dis, 2020, 104(6): 1751-1762.
- Wu J, Yu R, Wang H, Zhou C, Huang S, Jiao H, Yu S, Nie X, Wang Q, Liu S, Weining S, Singh R P, Bhavani S, Kang Z, Han D, Zeng Q. A large‐scale genomic association analysis identifies the candidate causal genes conferring stripe rust resistance under multiple field environments. Plant Biotechnol J, 2021, 19(1): 177-191.
- Xiang C, Feng J Y, Wang M N, Chen X M, See D R, Wan A M, Wang T. Molecular Mapping of Stripe Rust Resistance Gene Yr76 in Winter Club Wheat Cultivar Tyee. Phytopathology, 2016, 106(10): 1186.
- Xu L S, Wang M N, Cheng P, Kang Z S, Hulbert S H, Chen X M. Molecular mapping of Yr53, a new gene for stripe rust resistance in durum wheat accession PI 480148 and its transfer to common wheat. Theor Appl Genet, 2013, 126(2): 523-533.
- Yan X, Li M, Zhang P, Yin G, Zhang H, Gebrewahid T W, Zhang J, Dong L, Liu D, Liu Z, Li Z. High-temperature wheat leaf rust resistance gene Lr13 exhibits pleiotropic effects on hybrid necrosis. Mol Plant, 2021, 14(7): 1029-1032.
- Yan X, Zheng H, Zhang P, Weldu GT, Li Z, Liu D (2021) QTL mapping of adult plant resistance to stripe rust in the Fundulea 900 × Thatcher RIL population. Czech J Genet Plant Breed 57:1–8. https://doi.org/10.17221/71/2020-CJGPB
- Yang EN, Rosewarne GM, Herrera-Foessel SA, Huerta-Espino J, Tang ZX, Sun CF, Ren ZL, Singh RP (2013) QTL analysis of the spring wheat “Chapio” identifies stable stripe rust resistance despite inter-continental genotype × environment interactions. Theor Appl Genet 126:1721–1732. https://doi.org/10.1007/s00122-013-2087-8
- Yuan F P, Zeng Q D, Wu J H, Wang Q L, Yang Z J, Liang B P, Kang Z S, Chen X H, Han D J. QTL Mapping and Validation of Adult Plant Resistance to Stripe Rust in Chinese Wheat Landrace Humai 15. Front Plant Sci, 2018, 9: 968.
- Zeng Q, Wu J, Huang S, Yuan F, Liu S, Wang Q, Mu J, Yu S, Chen L, Han D, Kang Z. SNP-based linkage mapping for validation of adult plant stripe rust resistance QTL in common wheat cultivar Chakwal 86. Crop J, 2019, 7(2): 176-186.
- Zeng Q, Wu J, Liu S, Chen X, Yuan F, Su P, Wang Q, Huang S, Mu J, Han D, Kang Z, Chen XM (2019b) Genome-wide mapping for stripe rust resistance loci in common wheat cultivar Qinnong 142. Plant Dis 103:439–447. https://doi.org/10.1094/PDIS-05-18-0846-RE
- Zeng Q, Wu J, Liu S, Huang S, Wang Q, Mu J, Yu S, Han D, Kang Z. A major QTL co-localized on chromosome 6BL and its epistatic interaction for enhanced wheat stripe rust resistance. Theor Appl Genet, 2019, 132(5): 1409-1424.
- Zhang C, Huang L, Zhang H, Hao Q, Lyu B, Wang M, Epstein L, Liu M, Kou C, Qi J, Chen F, Li M, Gao G, Ni F, Zhang L, Hao M, Wang J, Chen X, Luo M C, Zheng Y, Wu J, Liu D, Fu D. An ancestral NB-LRR with duplicated 3’UTRs confers stripe rust resistance in wheat and barley. Nat Commun, 2019, 10(1): 4023.
- Zhang J, Hewitt T C, Boshoff W H P, Dundas I, Upadhyaya N, Li J, Patpour M, Chandramohan S, Pretorius Z A, Hovmøller M, Schnippenkoetter W, Park R F, Mago R, Periyannan S, Bhatt D, Hoxha S, Chakraborty S, Luo M, Dodds P, Steuernagel B, Wulff B B H, Ayliffe M, Mcintosh R A, Zhang P, Lagudah E S. A recombined Sr26 and Sr61 disease resistance gene stack in wheat encodes unrelated NLR genes. Nat Commun, 2021, 12(1): 3378.
- Zhang P, Lan C, Singh RP, Huerta-Espino J, Li Z, Lagudah E, Bhavani S (2022) Identification and characterization of resistance loci to wheat leaf rust and stripe rust in Afghan landrace “KU3067.” Front Plant Sci 13: 894528. https://doi.org/10.3389/fpls.2022.894528
- Zhang P, Li X, Gebrewahid T-W, Liu H, Xia X, He Z, Li Z, Liu D (2019c) QTL mapping of adult-plant resistance to leaf and stripe rust in wheat cross SW 8588/Thatcher using the wheat 55K SNP array. Plant Dis 103:3041–3049. https://doi.org/10.1094/PDIS-02-19-0380-RE
- Zhang P, Yan X, Gebrewahid TW, Zhou Y, Yang E, Xia X, He Z, Li Z, Liu D (2021) Genome-wide association mapping of leaf rust and stripe rust resistance in wheat accessions using the 90K SNP array. Theor Appl Genet 134:1233–1251. https://doi.org/10.1007/s00122-021-03769-3
- Zhang Y, Wang Z, Quan W, Zhang X, Feng J, Ren J, Jiang X, Zhang Z (2021b) Mapping of a QTL with major effect on reducing leaf rust severity at the adult plant growth stage on chromosome 2BL in wheat landrace Hongmazha. Theor Appl Genet 134:1363–1376. https://doi.org/10.1007/s00122-021-03776-4
- Zhou J, Singh RP, Ren Y, Bai B, Li Z, Yuan C, Li S, Huerta-Espino J, Liu D, Lan C (2021a) Identification of two new loci for adult plant resistance to leaf rust and stripe rust in the Chinese wheat variety ‘Neimai 836.’ Plant Dis 105:3705–3714. https://doi.org/10.1094/PDIS-12-20-2654-RE
- Zhou X, Hu T, Li X, YU M, Li Y, Yang S, Huang K, Han D, Kang Z (2019) Genome-wide mapping of adult plant stripe rust resistance in wheat cultivar Toni. Theor Appl Genet 132:1693–1704. https://doi.org/10.1007/s00122-019-03308-1
- Zhou X, Li X, Han D, Yang S, Kang Z, Ren R (2022b) Genome-wide QTL mapping for stripe rust resistance in winter wheat Pindong 34 using a 90K SNP array. Front Plant Sci 13: 932762. https://doi.org/10.3389/fpls.2022.932762
- Zhou X, Zhong X, Roter J, Li X, Yao Q, Yan J, Yang S, Guo Q, Distelfeld A, Sela H, Kang Z (2021b) Genome-wide mapping of loci for adult-plant resistance to stripe rust in durum wheat Svevo using the 90K SNP array. Plant Dis 105:879–888. https://doi.org/10.1094/PDIS-09-20-1933-RE
- Zhou XL, Han DJ, Chen XM, Mu JM, Xue WB, Zeng QD, Wang QL, Huang LL, Kang ZS (2015a) QTL mapping of adult-plant resistance to stripe rust in wheat line P9897. Euphytica 205:243–253. https://doi.org/10.1007/s10681-015-1447-7
- Zhou XL, Zhang Y, Zeng QD, Chen XM, Han DJ, Huang LL, Kang ZS (2015b) Identification of QTL for adult plant resistance to stripe rust in Chinese wheat landrace Caoxuan 5. Euphytica 204:627–634. https://doi.org/10.1007/s10681-014-1349-0
- Zhu Z, Cao Q, Han D, Wu J, Wu L, Tong J, Xu X, Yan J, Zhang Y, Xu K, Wang F, Dong Y, Gao C, He Z, Xia X, Hao Y. Molecular characterization and validation of adult-plant stripe rust resistance gene Yr86 in Chinese wheat cultivar Zhongmai 895. Theor Appl Genet, 2023, 136(6): 142.
- Zou J, Semagn K, Chen H, Iqbal M, Asif M, N’Diaye A, Navabi A, Perez-Lara E, Pozniak C, Yang R-C, Graf RJ, Randhawa H, Spaner D (2017) Mapping of QTLs associated with resistance to common bunt, tan spot, leaf rust, and stripe rust in a spring wheat population. Mol Breeding 37:144. https://doi.org/10.1007/s11032-017-0746-1
Thanks for the main dependent programs of this project

The R packages utilized during the development process
Background
Wheat is one of the most important cereal crops, with a global cultivation area exceeding 300 million acres. In recent years, factors such as global warming have lead to an increase in extreme weather events, which disrupt the prevalence patterns of crop diseases and pests, posing significant challenges to food security (Schulthess et al., 2022). Wheat yellow rust (YR) or stripe rust, caused by the biotrophic fungal Puccinia striiformis Westend f. sp. tritici, is one of the most critical diseases affecting wheat production worldwide, presenting a substantial threat to wheat safety and security. Breeding disease-resistant varieties is the most effective measure to control wheat yellow rust.
However, the discovery and utilization of effective resistance loci remain challenging in current wheat breeding practices. Comprehensive analysis of wheat stripe rust resistance loci at the population level is required to enhance flexibility in their application within breeding research (He et al., 2024). With the rapid advancements in genomics, the availability of multi-omics data on wheat has expanded significantly. Published online databases such as WheatOmics (Ma et al., 2021) and TGT (Chen et al., 2020) have accelerated the progress of wheat research. However, there is currently no publicly available, practical database specifically focused on wheat stripe rust resistance.
To address this gap, we have constructed a dynamic landscape of wheat yellow rust resistance loci to provide a valuable reference for research in wheat disease resistance genetics and breeding. Based on cloud computing architecture, we have developed an interactive online platform (https://wheat.dftianyi.com/), freely accessible to wheat genetic and breeding researchers worldwide. This platform offers real-time query and analysis modules for wheat rust resistance loci, aiming to expedite the intelligent design of wheat breeding in the future.
Usage method
The main functional modules of LWRR include: population genetic structure analysis, material information query, phenotype data analytics, GWAS result analysis, QTL information retrieval, disease resistance candidate gene analysis, etc., and provide online cloud tools to upload genotype and phenotype files to quickly complete candidate gene analysis. LWRR is designed with a dynamic responsive architecture, including 12 sub-menu pages (from population-level genetic analysis to individual-level phenotypic attributes, which is convenient for users to quickly browse). It has the characteristics of online access, easy use, dynamic interaction, and comprehensive . So that breeding researchers can quickly inquire about the change law of wheat rust resistance check point population level, the difference of QTL check point between different materials, and the online analysis of disease resistance candidate genes in the study, providing support for future wheat disease resistance design and breeding.
1. Population genetic structure analysis
The “Population” module provides information on material sources and population structure, as well as comparison and analysis between different breeding groups. Through Structure analysis of population genetic composition, users can select different K values to view specific results, and can zoom the horizontal axis to view the results of the specified sample. The mouse click will display the information of the corresponding sample in real time. In addition, PCA interactive 3D query of different subpopulations and different breeding groups is provided, which is convenient for obtaining population characteristics and structural grouping information. In order to facilitate the study of selective domestication patterns and genetic characteristics between different subpopulations, we calculated the results of Pi, Fst, TajimD and other results of different breeding groups and farmers at the genome level, and provided a dynamic query function. Users can enter any chromosome region to query the corresponding detailed data. We conducted statistical analysis of the four breeding groups, and displayed them according to the source region, breeding age, and population structure, so that users can easily understand the characteristics and information of the breeding groups.
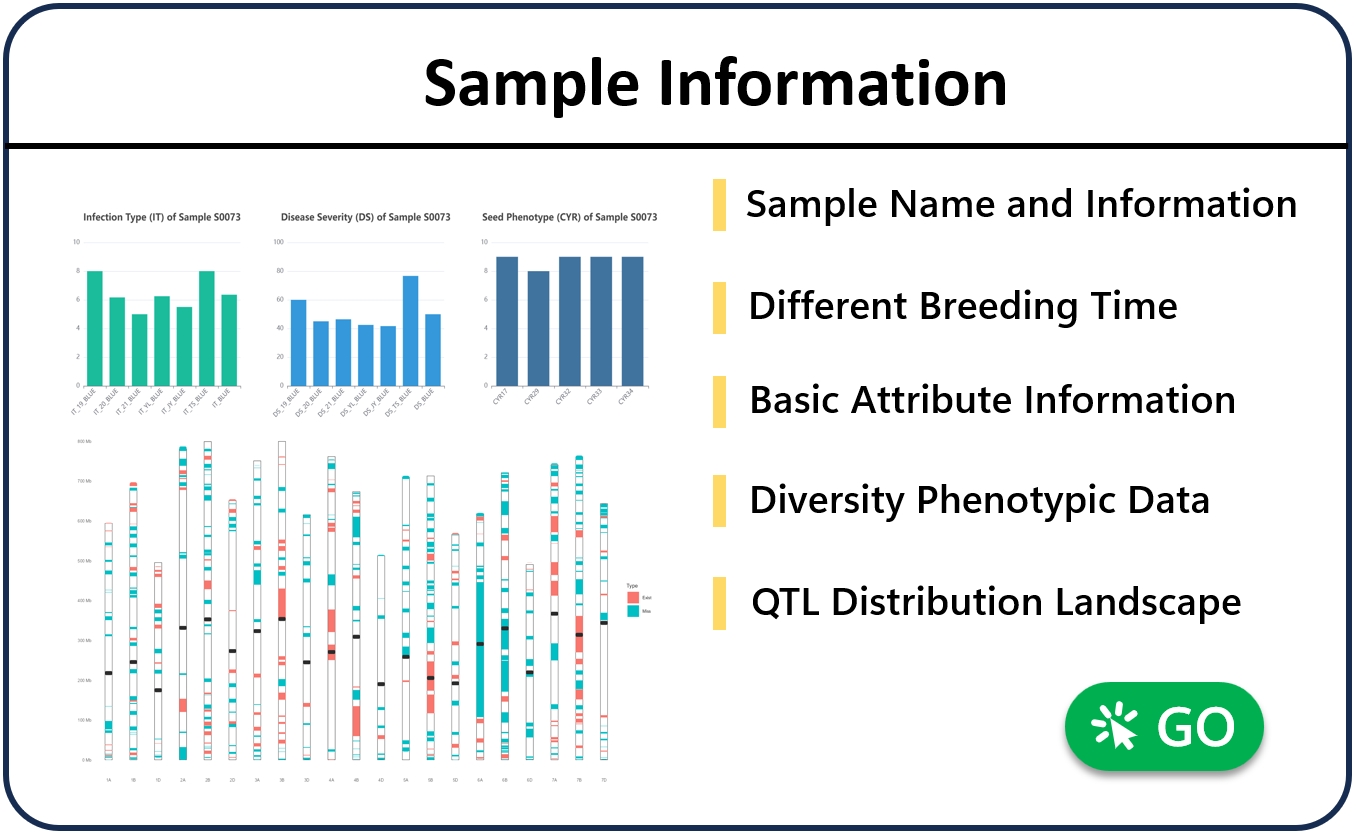
2. Sample information query
The “sample” module provides information and attribute queries for individual samples, as well as the QTL status of embroidery resistance they contain. When the user enters a material number or name, the page will display the material’s attribute information and QTL distribution, such as querying the “S0073” sample. The page provides the disease resistance of the sample under different phenotypic conditions, and shows the presence of different QTLs in the material, as well as the allele types with excellent disease resistance. When the user clicks on the blue QTL hyperlinke, it will automatically jump to the corresponding QTL information interface. Through the panorama at the full chromosome level, it can quickly find which QTLs are potential key check points.
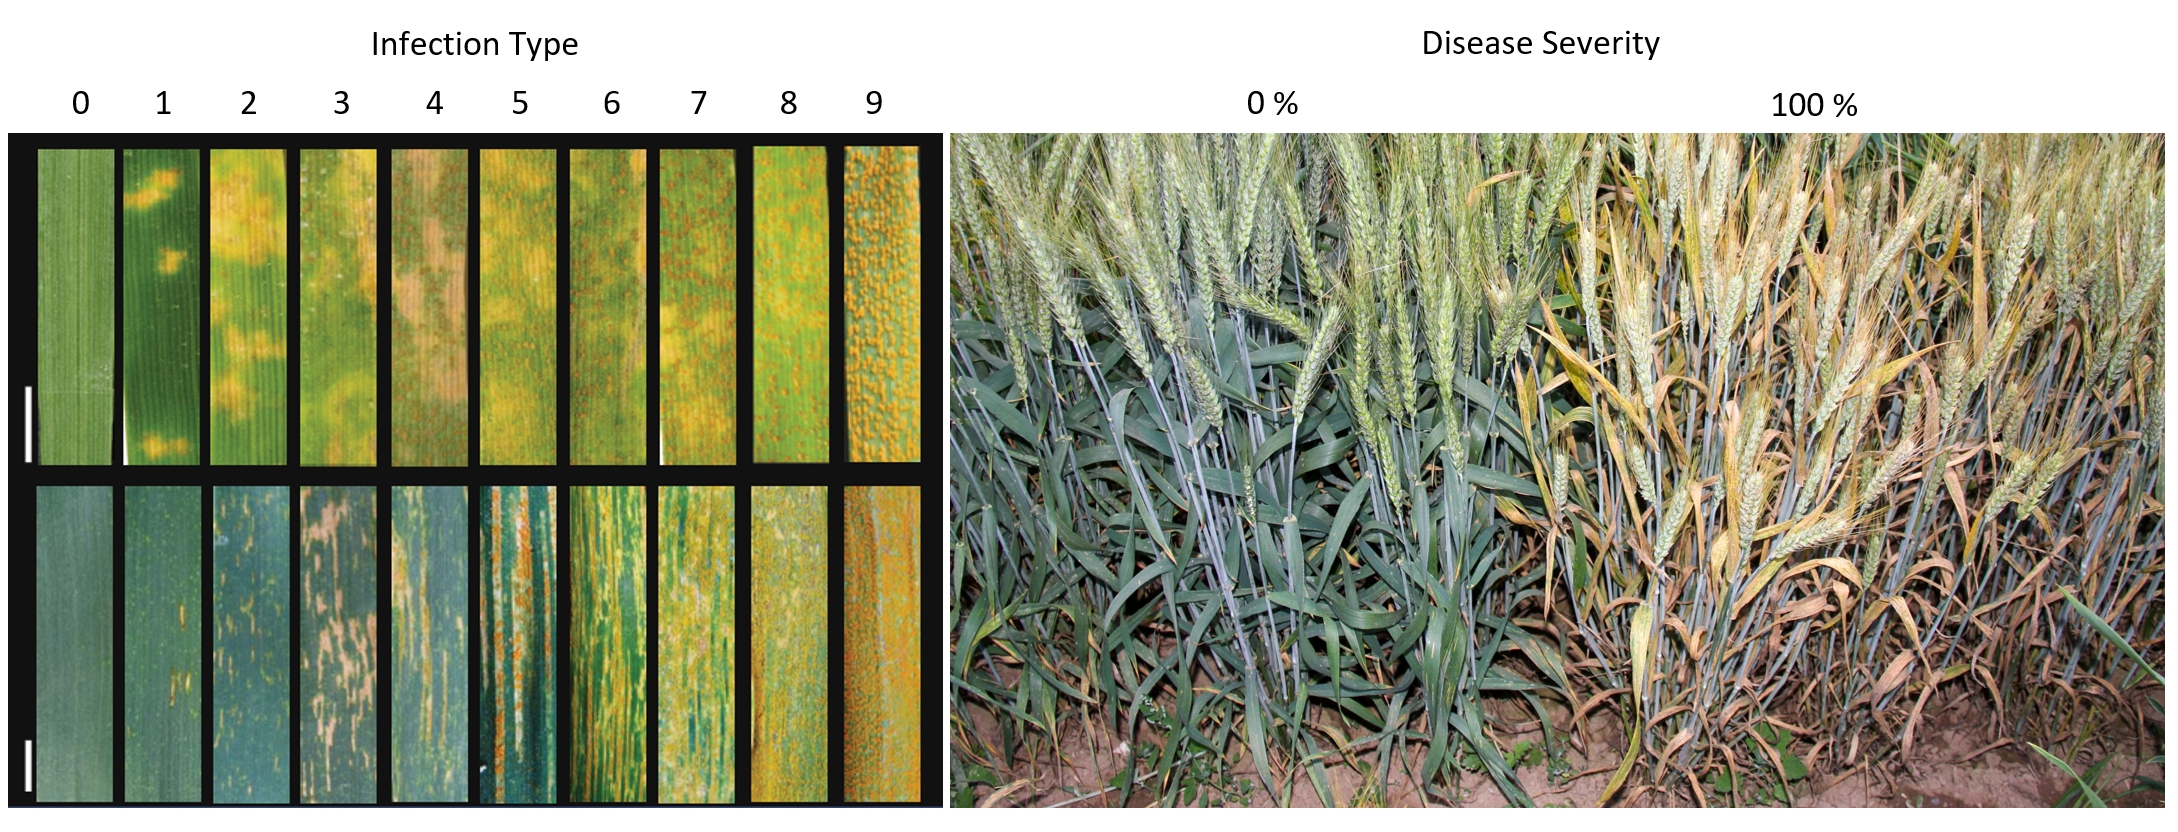
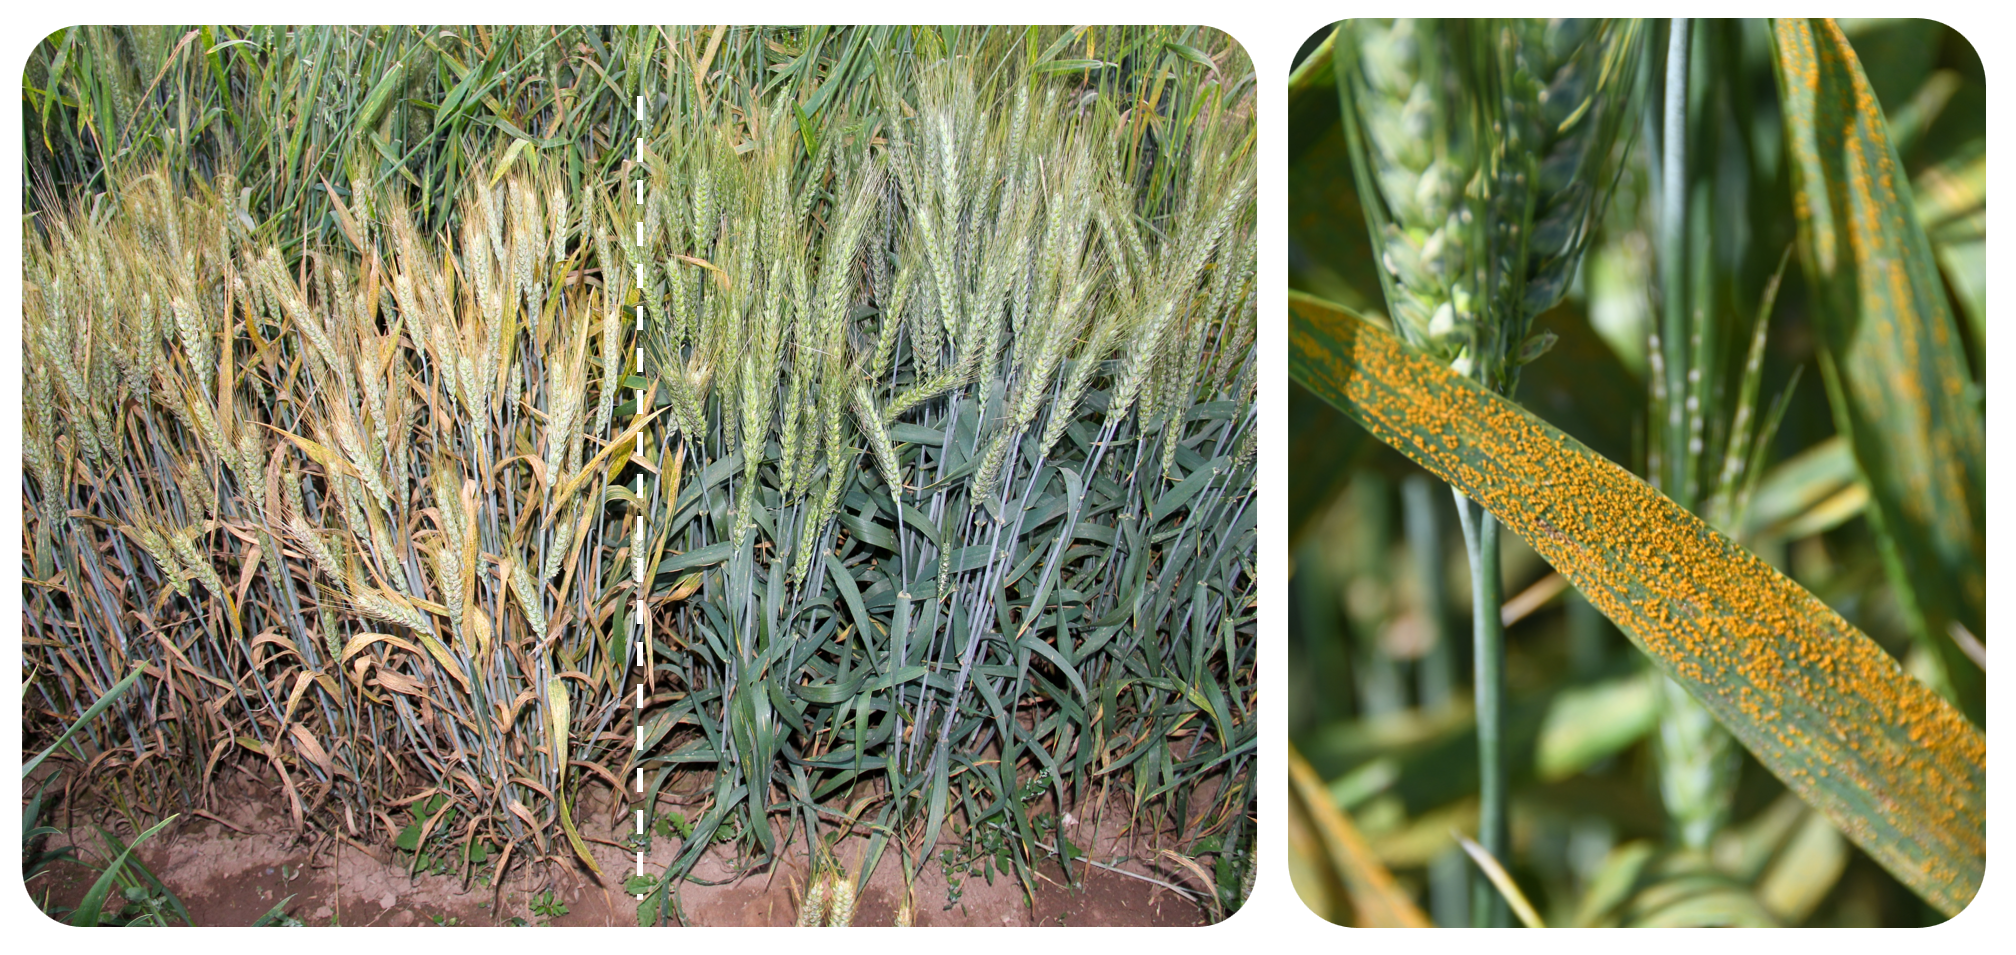
3. Phenotype data analytics
The “Phenotype” module provides statistical analysis of phenotype information of different materials. Generally speaking, the resistance of wheat to stripe rust can be divided into two types: seedling stage and adult stage. The resistance at seedling stage is specific to small species. Therefore, this module provides phenotype analysis of different physiological races of wheat stripe rust. Users can choose to view the phenotype data of different physiological races at seedling stage. Through boxplot, they can quickly understand the material resistance differences of different breeding groups. According to the frequency distribution histogram, they can clearly understand the distribution trend of phenotype data. Heat map shows the specific values corresponding to different materials in different phenotypes.
4. GWAS result analysis
The “GWAS” module provides the result query of genome-wide association analysis, including all the check points obtained by association analysis that have significant association points with phenotypes. The website provides Manhattan graphs and qq graphs obtained by each phenotype under MLM and FarmCPU models. In order to further facilitate users to obtain the results of an interval of interest, we use the online query function to provide more fine-grained functions. Users can select a phenotype, query the significant check points corresponding to a certain interval, and view the specific information of a significant SNP (physical precise location and effect value, etc.) by clicking the mouse. It is convenient for users to make full use of the significant check points for extended analysis. We label all the significance thresholds -log10 (P) greater than 3 The check points are provided in the form of tables, and when users find a GWAS candidate interval of interest, they can also perform in-depth analysis based on the check point information.
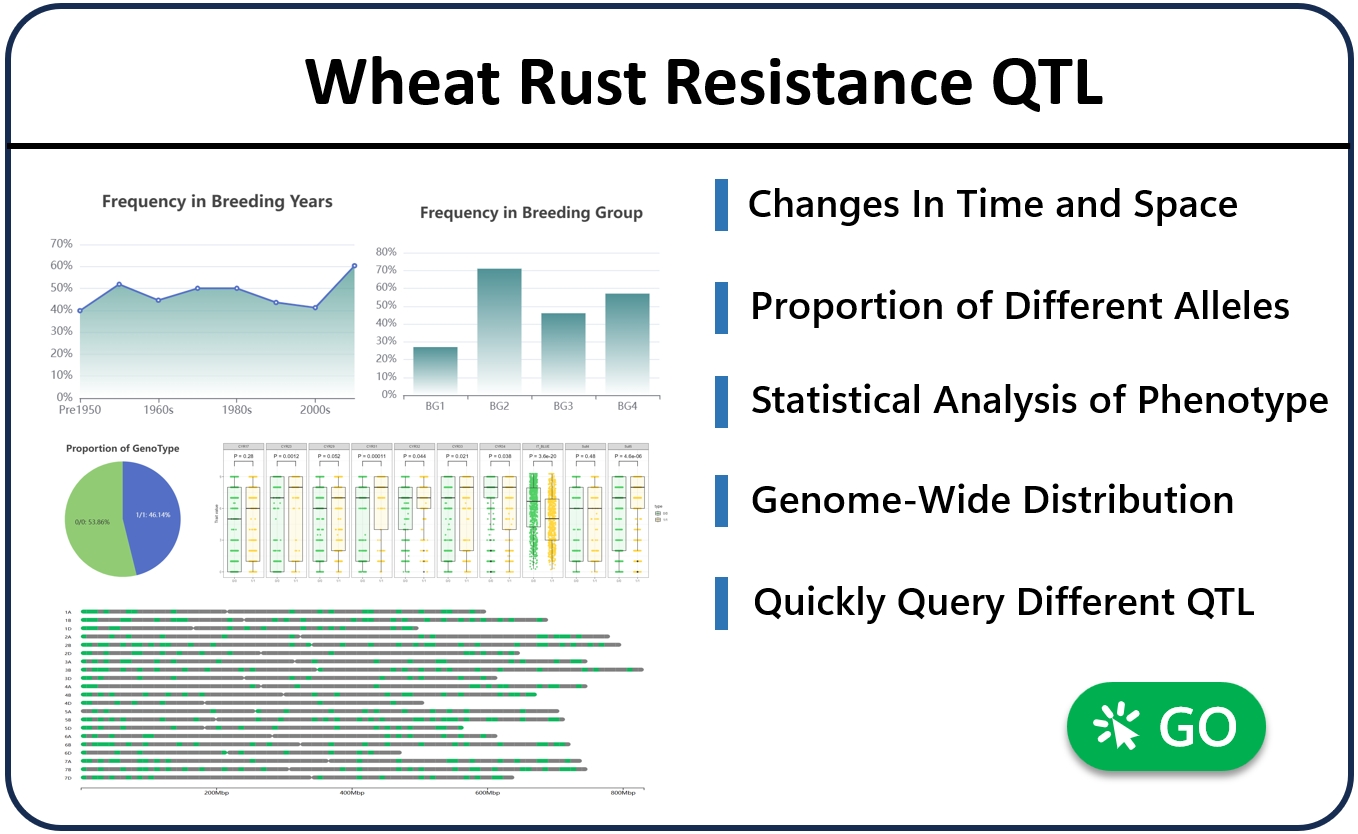
5. QTL information retrieval
The “QTL” module provides a one-stop query and analysis of QTL check points for wheat resistance to stripe rust, including specific information such as the location interval of each QTL check point, and can query the proportion of different alleles at the population level, as well as the utilization differences of different ages and breeding groups . For example, search for “Yr30” (you can enter known gene numbers, QTL numbers, reported QTL numbers, etc., the server uses a global search engine), the page will show the QTL corresponding to the Yr30 gene and the change in the utilization trend of the gene since 1950, as well as the difference in utilization among the four breeding groups. The page automatically displays the phenotypic differences of different genotypes of alleles corresponding to the check point, and statistical analysis is carried out through T-test. The above calculation results are based on population-level variant check point genotype data and statistical analysis of phenotype data in multiple environments. Users can view the panorama of the distribution of disease-resistant QTL check points at the genome-wide level, and select a green area with the mouse to jump to the corresponding QTL to view. In addition, the page also shows the list of candidate genes in the corresponding interval of QTL, which is convenient for users to view candidate genes.
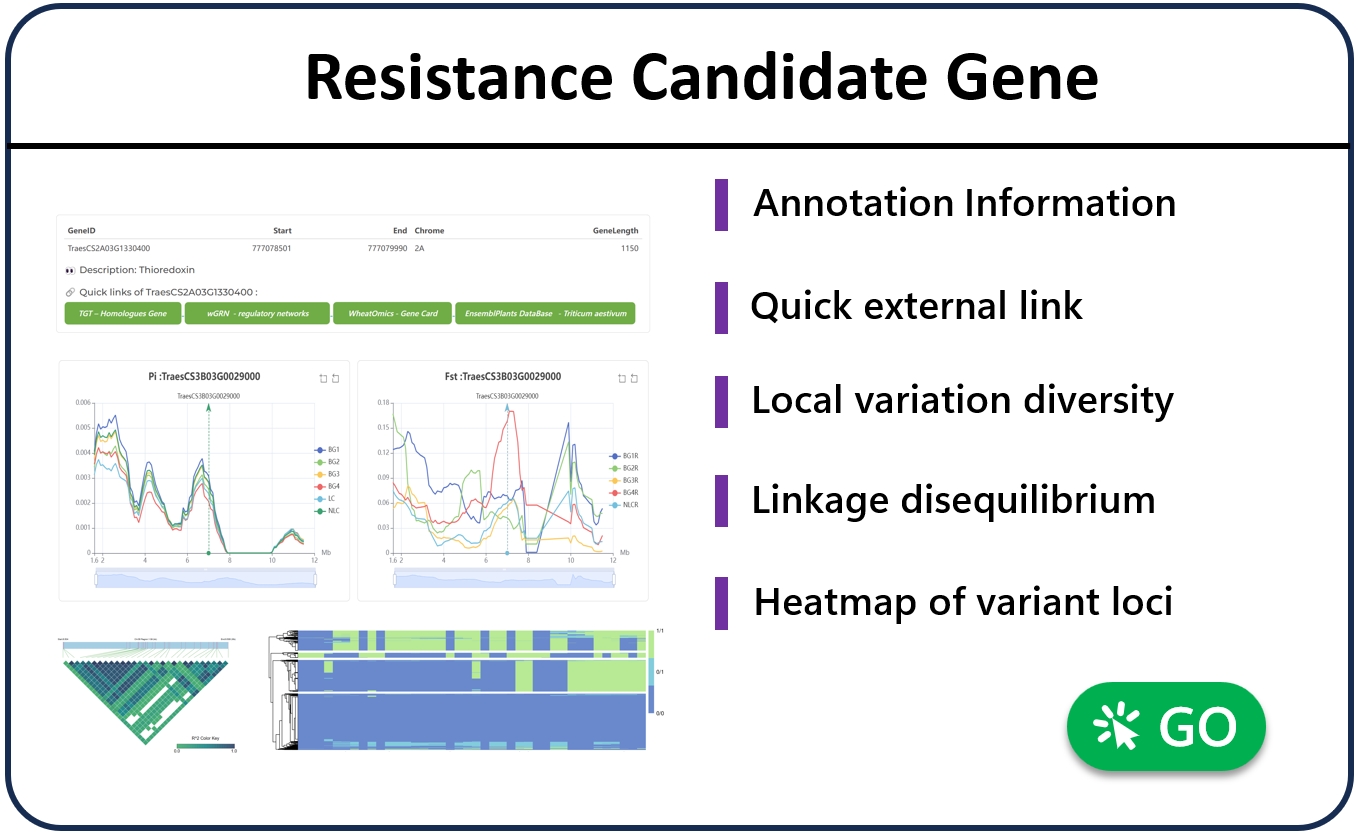
6. Disease resistance candidate gene analysis
The “Tools” module integrates online analysis tools, allowing users to upload candidate genes for quick analysis by themselves. Based on the cloud computing service framework, users can upload VCF genotype files and Excel phenotype files of candidate genes (the tool provides sample data and file formats), and then calculate and analyze in real time in the LWRR cloud. One-stop gene mutation check point analysis, candidate gene association analysis, single marker check point significance statistical test, linkage imbalance analysis, gene haplotype analysis, etc. The analysis results can be quickly viewed on the page, or they can be saved locally through the download function provided by the tool. For security and confidentiality, all data is encrypted and transmitted through SSL, and each user session has a unique temporary random number. Uploaded files and results are stored in the temporary cache space, which is automatically deleted after the user exits the use.
Feedback on the issue
https://github.com/CropCoder/LWRR/issues
If you have any questions or suggestions, please feel free to give feedback on the above website.
- Technology: Jiwen Zhao (zhaojiwen@nwafu.edu.cn)
- Cooperation: Jianhui Wu (wujh@nwafu.edu.cn)
- Website: https://wheat.dftianyi.com/
- Github: https://github.com/CropCoder/LWRR